1. Discuss the eight principles of the ISO 9000 standard
The ISO 9000 standard is based on eight principles:
Customer Focus: Understand the customer’s needs, meet the customer’s requirements, and strive to exceed the customer’s expectations.
Leadership: Establish unity of purpose and organizational direction and provide an environment that promotes employee involvement and achievement of objectives.
Involvement of People: Take advantage of fully involved employees, using all their abilities for the benefit of the organization
Process Approach: Recognize that things accomplished are the results of processes and that processes along with related activities and resources must be managed.
System Approach to Management: The multiple interrelated processes that contribute to the organization’s effectiveness are a system and should be managed as a system.
Continual Improvement: Continual improvement should be a permanent objective applied to the organization and to its people, processes, systems, and products.
Factual Approach to Decision Making: Decisions must be based on the analysis of accurate, relevant, and reliable data and information.
Mutually Beneficial Supplier Relationships: Both the organization and the supplier benefiting from one another’s resources and knowledge results in value for all.
2. Discuss Pareto Charts
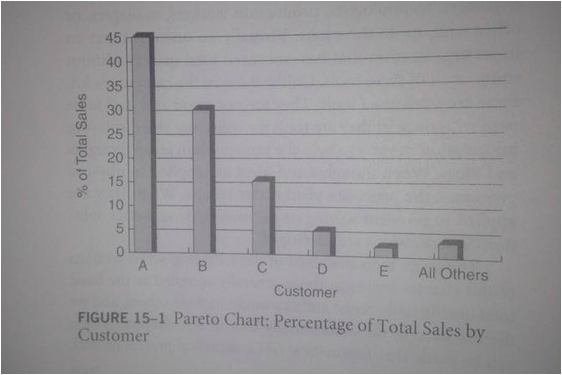
Pareto Charts basically measure the various sources impacting one base. For example, total sales for a company could be the base and the various customers would represent the sources. The picture below depicts this
As it can be observed the three main customers A,B and C have the biggest impact on sales for this specific organization. This means the company can either use the Pareto chart to focus only on A,B,C or use it to increase sales on D, E and all others. The chart itself is very useful and can be used for various approaches to a problem.

3. Discuss fishbone diagrams
The Fishbone Diagram is a way to capture the different ideas for the root cause. It’s a visually of the potential cause which may create problems or defects. This diagram is also called cause-and-effect diagram to identify and isolate causes of a problem.
The left side shows all the causes that lead to the right side which has the effect. It is use to structure a brainstorming session. In addition, the why question can be asked to further the details.
4. Discuss Histogram
Histograms are mainly used to record frequency of occurrence, meaning the number of times something is done is recorded by the Histogram. For example we may want to know how many x items are in a particular number of examples.
Histograms are mainly used to record frequency of occurrence, meaning the number of times something is done is recorded by the Histogram. For example we may want to know how many x items are in a particular number of examples.
5. Discuss control charts for variables
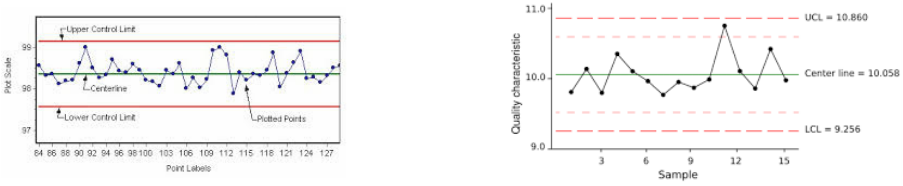
Control charts are the appropriate tool to monitor processes. The properly used control chart will immediately alert the operator to any change in the process. Having eliminated a problem's root cause, that problem should never recur. Control charts also enable continual improvement of processes.
As long as the plots stay between the limits and don't congregate on one side, the process is in statistical control. If either of these condition is not met, then we can say that the process is not in statistical control or out of control. Usually the plot has to stay in between the UCL and LCL, otherwise it is called as going out of control.
6. Discuss flowcharts and give a simple example
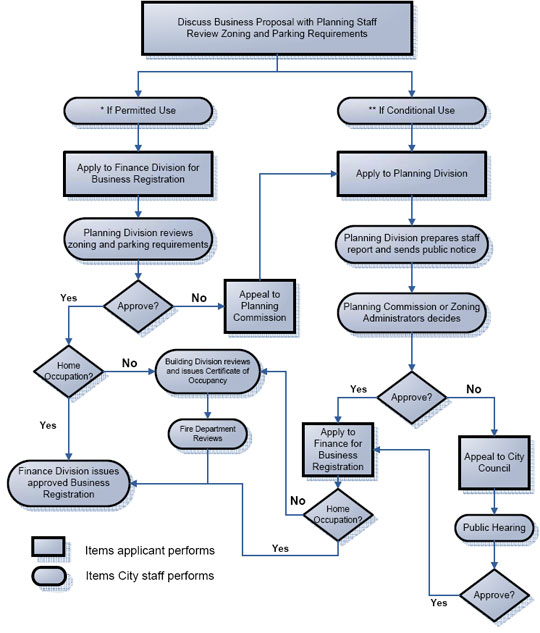
A flowchart is a graphic representation of a process. A necessary step in improving a process is to flowchart it. In this way, all parties involved can begin with the same understanding of the process. A flowchart is a type of diagram that represents an algorithm, workflow or process, showing the steps as boxes of various kinds, and their order by connecting them with arrows. This diagrammatic representation illustrates a solution model to a given problem. Flowcharts are used in analyzing, designing, documenting or managing a process or program in various fields.
An example of flow chart:
7. Explain what is an FMEA
Failure mode and effects analysis (FMEA) tries to identify all possible potential failures of a product or process, prioritize them according to their risk, and set in motion action to eliminate or reduce the probability of their occurrence. FMEA just tries to identify all the possible types (modes) of failures that could happen to a product or a process before they happen. Once the possible “failure modes” have been identified, the “effects analysis” kicks in and studies the potential consequences of those failures. Next, the consequences of each potential failure are ranked by
1. Seriousness/Criticality to the customer
2. Probability of the fault’s occurrence
3. Probability of the fault’s detection by the systems
4. Responsible for defect prevention or detection
8. Provide an overview of the Toyota practical problem solving process
The Toyota practical problem solving process is composed of 7 steps including sub steps. The steps are as follow
1) Perceive the initial Problem
2) Clarify the problem
3) Determine the Point of Cause
4) Determine the root Cause using the Five Why Analysis
5) Develop and implement a Countermeasure
6) Determine the effectiveness of the Countermeasure
7) Change the standard
9. Explain a total quality decision making process
Decision making process is a logically sequenced series of activates through which decisions are made.
Decision making means:
Decision making is the process of selecting one course of action from among two or more alternatives.
Identify or Anticipate the Situation: - Anticipating the situation is like driving defensively; never assume anything. Look, listen, ask, and sense.
Gather the Facts: - This manager might identify the problem as poor morale and begin trying to improve it. However, he or she would do well to gather the facts first to be certain of what is behind the negative attitudes.
Consider Alternatives: - Considering the alternatives involves two steps: (1) list all of the various alternatives available and (2) evaluate each alter- native in light of the facts.
Choose the Best Alternative, Implement, Monitor, and Adjust: - After all alternatives have been considered, one must be selected and implemented, and after an alternative has been implemented, managers must monitor progress and adjust appropriately.
10. Explain why quality tools are important
Importance of quality tools :
Quality management includes planning, processes, and acceptable, organized outcomes. Quality management tools and some useful steps to follow are:
Project Planning – Here you should create a project checklist as well as a project control process. Team members can use this planning phase to identify possible conflicts, changes, or risks associated with the project and, at this stage, should write the project scope.
Pareto Charts – A Pareto chart is an easy way to identify tasks within the project and prioritize their importance. The final goal of the Pareto chart is to determine where to maximize efforts to obtain maximum results.
Fishbone Charts – The fishbone chart identifies faults or problems in the process or project. It is often used as a graphic demonstration to identify problems, their causes and effect.
Histogram – This bar chart includes project variables and identifies root problems. It can also provide a glimpse of where problems lie in relation to the entire project, or on how large scale they appear.
Charts and Graphs – Visual components are often the best way to understand your quality management process to see how well it functions initially and throughout the project, and to evaluate project outcomes.
Social Networking Article
1. Energy Efficient Rail Transportation:
This article is about vitality sparing and eventual fate of USA as far as rail transport. Numerous states here essentially relying upon rail transport so it should be enhanced and on future we may confront genuine results in the event that we don't attempt to enhance our vitality productive advancements. It is verifiable truth that expansive measure of energies are squandered amid stoppage . While beginning train from unmoving position it additionally require same measure of vitality while squandered amid stoppage. To beat this issue and to bolster eco well disposed advances new innovation like ultra capacitors need to utilized like "The south eastern Pennsylvania power"
2. Wine Making waste can produce Bio Fuel:
Overall wine era leaves a normal 13 million tons of grape marc misuse each year. Comprehensively it is assessed that couple of hundred thousand tons are made each year and it is generally disposed of to a detriment to the winery. A large portion of the starches found in grape marc could be changed over particularly to ethanol through development with a yield of up to 270 liters for every ton of grape marc. The remaining thing was suitable for use as an animal nourishment or fertilizer.
Ethanol yields could be extended by pre-treatment with destructive and proteins up to 400 liters a ton. Utilizing plant biomass for the production of liquid biofuels can be troublesome in perspective of it essential complex nature that is not by and large viably isolated. Grape marc is instantly open, can be sourced productively and is rich in the kind of sugars that are easily matured Overall wine era leaves a normal 13 million tons of grape marc misuse each year. Comprehensively it is assessed that couple of hundred thousand tons are made each year and it is generally disposed of to a detriment to the winery. A large portion of the starches found in grape marc could be changed over particularly to ethanol through development with a yield of up to 270 liters for every ton of grape marc. The remaining thing was suitable for use as an animal nourishment or fertilizer.
Ethanol yields could be extended by pre-treatment with destructive and proteins up to 400 liters a ton. Utilizing plant biomass for the production of liquid biofuels can be troublesome in perspective of it essential complex nature that is not by and large viably isolated. Grape marc is instantly open, can be sourced productively and is rich in the kind of sugars that are easily matured.
3. Material which stops its own leak:
An extremely intriguing article! Another sort of materiel which itself recuperate its harm or crack. This is going to have gigantic effect since it can be life sparing in numerous events and this will definetly space missions too.
We have seen part of disappointments and catastrophes in space missions this will have gigantic effect in future. Since space missions are erratic and it for the most part relies on upon air weight and climatic conditions, it will assume a vital part here .
An extraordinary development from college of Michigan scientists.
